
Continued uncertainty over the future of the dollar serves to buoy the safe haven amongst currencies aiming for bankruptcy.
First came Portugal, Ireland, Greece, Spain.. [the PIGS] and there was Dubai. Hints of problems coming from Singapore, the UK, and the last house of cards to fall..? the USA..or as many know it infamously as, IOUSA.
So what is an options playa to do?
Let's look at the recent chart for silver.

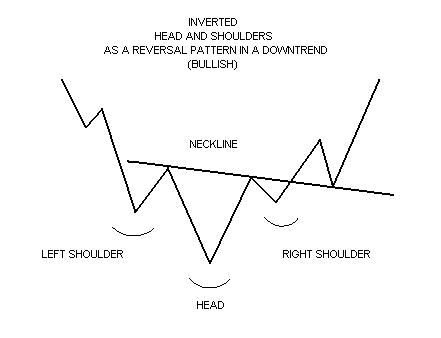
If you examine the trend lines I drew out, silver has a nice upside down head and shoulders pattern previously.
In this example of technical analysis where we look at the moods and attitudes of the marketplace rather than say, the fundamentals such as ratios, hard numbers and other financial data.
A head and shoulders pattern elaborated looks like:
Walah!
Did I see this pattern when I made my initial trade (NO..), I got lucky.
"Damn Warren, you just got lucky."
No, I knew the fundamentals anyway too but hell, being in position to be lucky is awesome too.
Typically, the strength of the trend that follows a head and shoulders pattern is equal the distance of the "head" to the rest of the "body" in the pattern.
If you look at the trend lines I drew previously on the silver chart, it shows the vertical height that has been duplicated in the recent bullish trend of silver.
I've been waiting for an indicator to sell because, hey, it's great to see nice big fat green precentanges in my profit/loss column, but till I sell my options, the trend might reserve and suffer a pullback in a overheated market.
Other awesome indicators are MACD and the RSI.
What Does Moving Average Convergence Divergence - MACD Mean?
A trend-following momentum indicator that shows the relationship between two moving averages of prices. The MACD is calculated by subtracting the 26-day exponential moving average (EMA) from the 12-day EMA. A nine-day EMA of the MACD, called the "signal line", is then plotted on top of the MACD, functioning as a trigger for buy and sell signals.
With MACD, you're looking for a convergence of the slower moving average and the faster moving average. It'll converge at low points and re-converge at overheated points.
What Does Relative Strength Index - RSI Mean?
A technical momentum indicator that compares the magnitude of recent gains to recent losses in an attempt to determine overbought and oversold conditions of an asset. It is calculated using the following formula:
Just look at how a low RSI tends to correlate with a low price.
Notice how high the RSI is currently...
~ ~ ~ ~
Um...
Yes. Selling in the morning.
^^

No comments:
Post a Comment